In the table, the vector ![]() is considered with the states on the vector
is considered with the states on the vector ![]() . In the column Z', the subsequent states of Zk are written in connection with the vector
. In the column Z', the subsequent states of Zk are written in connection with the vector ![]() .
.
The task now is to generate input sequences that can be used to simulate the automaton. As described in detail, there are ![]() possible input combinations.
possible input combinations.
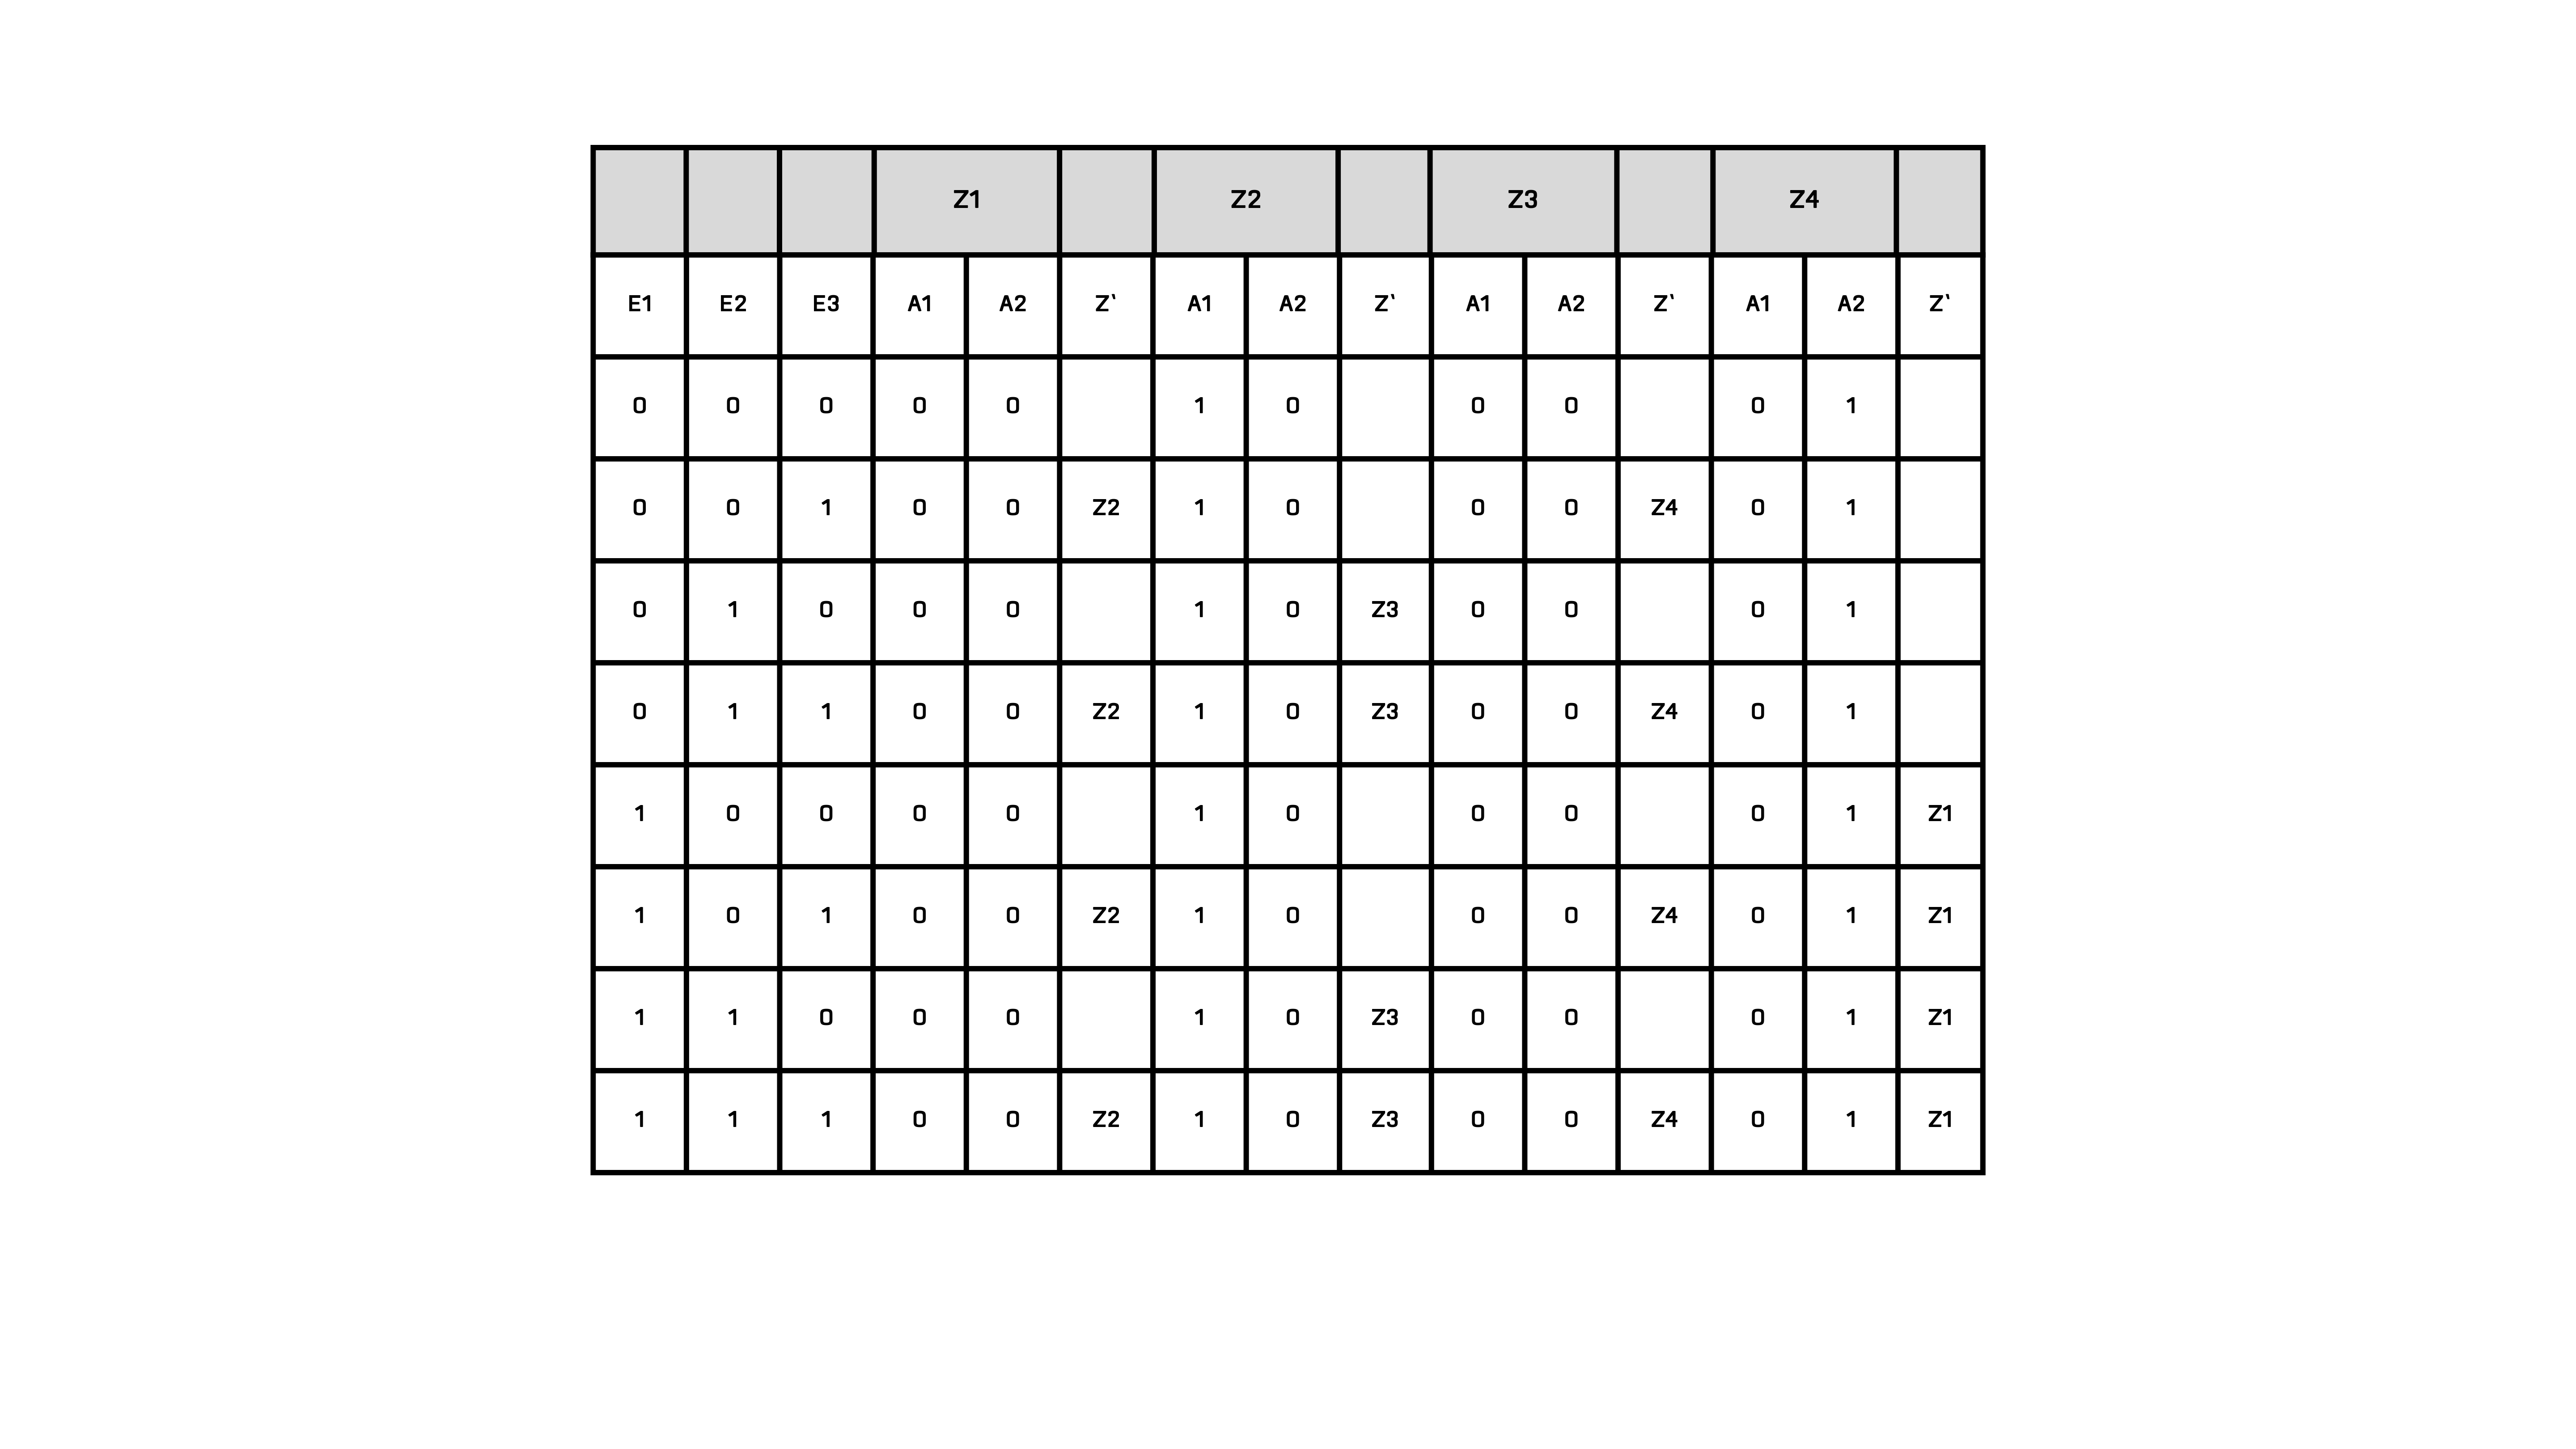
The input vector with the elements E1, E2 and E3 corresponds to a scenario in the control path with each combination.
At first glance, it is clear that not every input vector provides a defined result. All states are passed through, but multiple transitions can result in several input vectors from one state leading to a switching of states. The representation of the output vectors shows a clear assignment of the outputs to the states. The transitions are carried out independently of the overall system state. A meaningful simulation cannot be found here. The input vectors that are not explicitly considered in the control algorithm cannot be interpreted in the model. This leads to the statement:
The model can only interpret inputs from the control path that were taken into account in the control algorithm during the control design.
This statement leads to the conclusion that, with regard to the software quality criteria of functionality and reliability, the simulation has shown that these criteria are not fulfilled. Since not every input vector leads to a defined result and since the transitions are considered "fulfilled" several times. This means that the validity of the formal specification by the model is not satisfactory.